Uptime Kuma
Add New Monitor
Tip
Set Retries to 1 to reduce the false positives.
Installation
To install for user monitor, use these instructions modified from the non-docker installation from https://github.com/louislam/uptime-kuma.
Change to the monitor user:
sudo -u monitor -i
Install the prebuild binaries of node.js https://nodejs.org/en/download/prebuilt-binaries
wget https://nodejs.org/dist/v22.11.0/node-v22.11.0-linux-x64.tar.xz
tar -xf node-v22.11.0-linux-x64.tar.xz
Add /home/monitor/node-v22.11.0-linux-x64/bin to the path for user monitor add the following line to .bashrc:
export $HOME/node-v22.11.0-linux-x64/bin:$PATH
Reread the .bashrc
source ~/.bashrc
Install uptime kuna:
git clone https://github.com/louislam/uptime-kuma.git
cd uptime-kuma
npm run setup

npm install pm2 -g && pm2 install pm2-logrotate

pm2 start server/server.js --name uptime-kuma

pm2 save && pm2 startup
Exit from the monitor user back to your user and run the command output by pm2 startup:
sudo env PATH=$PATH:/home/monitor/node-v22.11.0-linux-x64/bin /home/monitor/node-v22.11.0-linux-x64/lib/node_modules/pm2/bin/pm2 startup systemd -u monitor --hp /home/monitor
Nginx should be added to the salt states and applied. At present include configuration file is not setup (Note: when using nginx as reverse proxy for uptime kuna it cannot be in a sub directory). This is the first attempt at a salt template:
server {
  {%- if interface_ips %}
  {%- for interface_ip in interface_ips %}
  listen {{ interface_ip }}:80;
  {%- endfor %}
  {%- else %}
  listen 80;
  {%- endif %}
  server_name {{ domain }} {{ redirect }};
  add_header X-Content-Type-Options nosniff;
  add_header X-XSS-Protection "1; mode=block";
  return 301 https://{{ domain }}$request_uri;
  access_log /var/log/nginx/{{ domain }}-access.log timed;
  error_log /var/log/nginx/{{ domain }}-error.log;
}

server {
  client_max_body_size 149m;
  server_name {{ domain }};
  {% if ssl -%}
  {%- if interface_ips %}
  {%- for interface_ip in interface_ips %}
  listen {{ interface_ip }}:443 ssl http2;
  {%- endfor %}
  {%- else %}
  listen 443 ssl http2;
  {%- endif %}
  {%- include 'nginx/_ssl.conf' -%}
  {% else -%}
  {%- if interface_ips %}
  {%- for interface_ip in interface_ips %}
  listen {{ interface_ip }}:80;
  {%- endfor %}
  {%- else %}
  listen 80;
  {%- endif %}
  {% endif %}
  {% include 'nginx/_headers.conf' %}

  location / {
      proxy_pass         http://localhost:3001;
      proxy_http_version 1.1;
      proxy_set_header   Upgrade $http_upgrade;
      proxy_set_header   Connection "upgrade";
      proxy_set_header   Host $host;
  }

  access_log /var/log/nginx/{{ domain }}-access.log timed;
  error_log /var/log/nginx/{{ domain }}-error.log;
}
With the DO API key installed, run:
init-letsencrypt --do-dns <domain> [<redirect domain if required>]
Reload the nginx configuration using:
sudo nginx -t
sudo systemctl reload nginx
If not using a public ip, to access add the fqdn to your /etc/hosts table and browse to the server address.
On first login the you will be prompted to create a user name and password - there is no user management so this is the only user that can be created.
Configuration
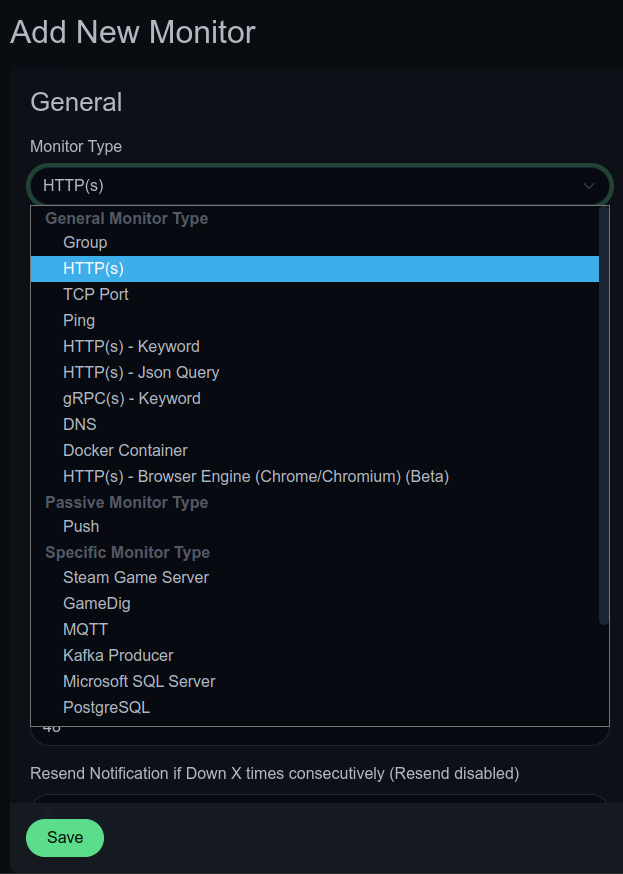
Once uptime kuma is setup, you may need to configure domains after you add them by default this is set to HTTP(s), however you may want to ping a website if for some reason you cannot connect via HTTPs, or even search for specific keywords
This can be useful when working with certain websites, as each one is different so being able to search to see if the content has gone missing can be helpful.

As you can see in the image above, we have multiple options to select from, just simply select your method of monitoring and fill in the fields.

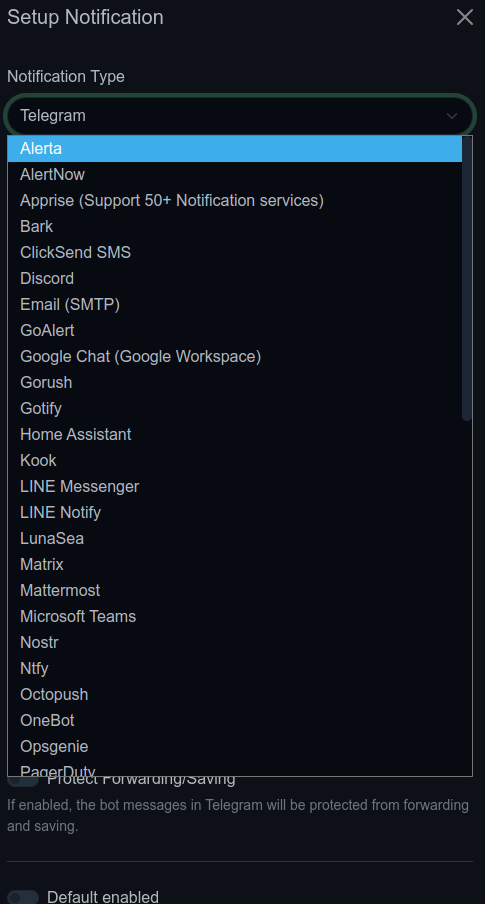
And here you can see the different methods of notification you can apply each has it’s own page for you to do whatever you need on there, most requiring webhooks. However this does give us great control over our monitoring as if setup correctly, you will be on top of everything.